
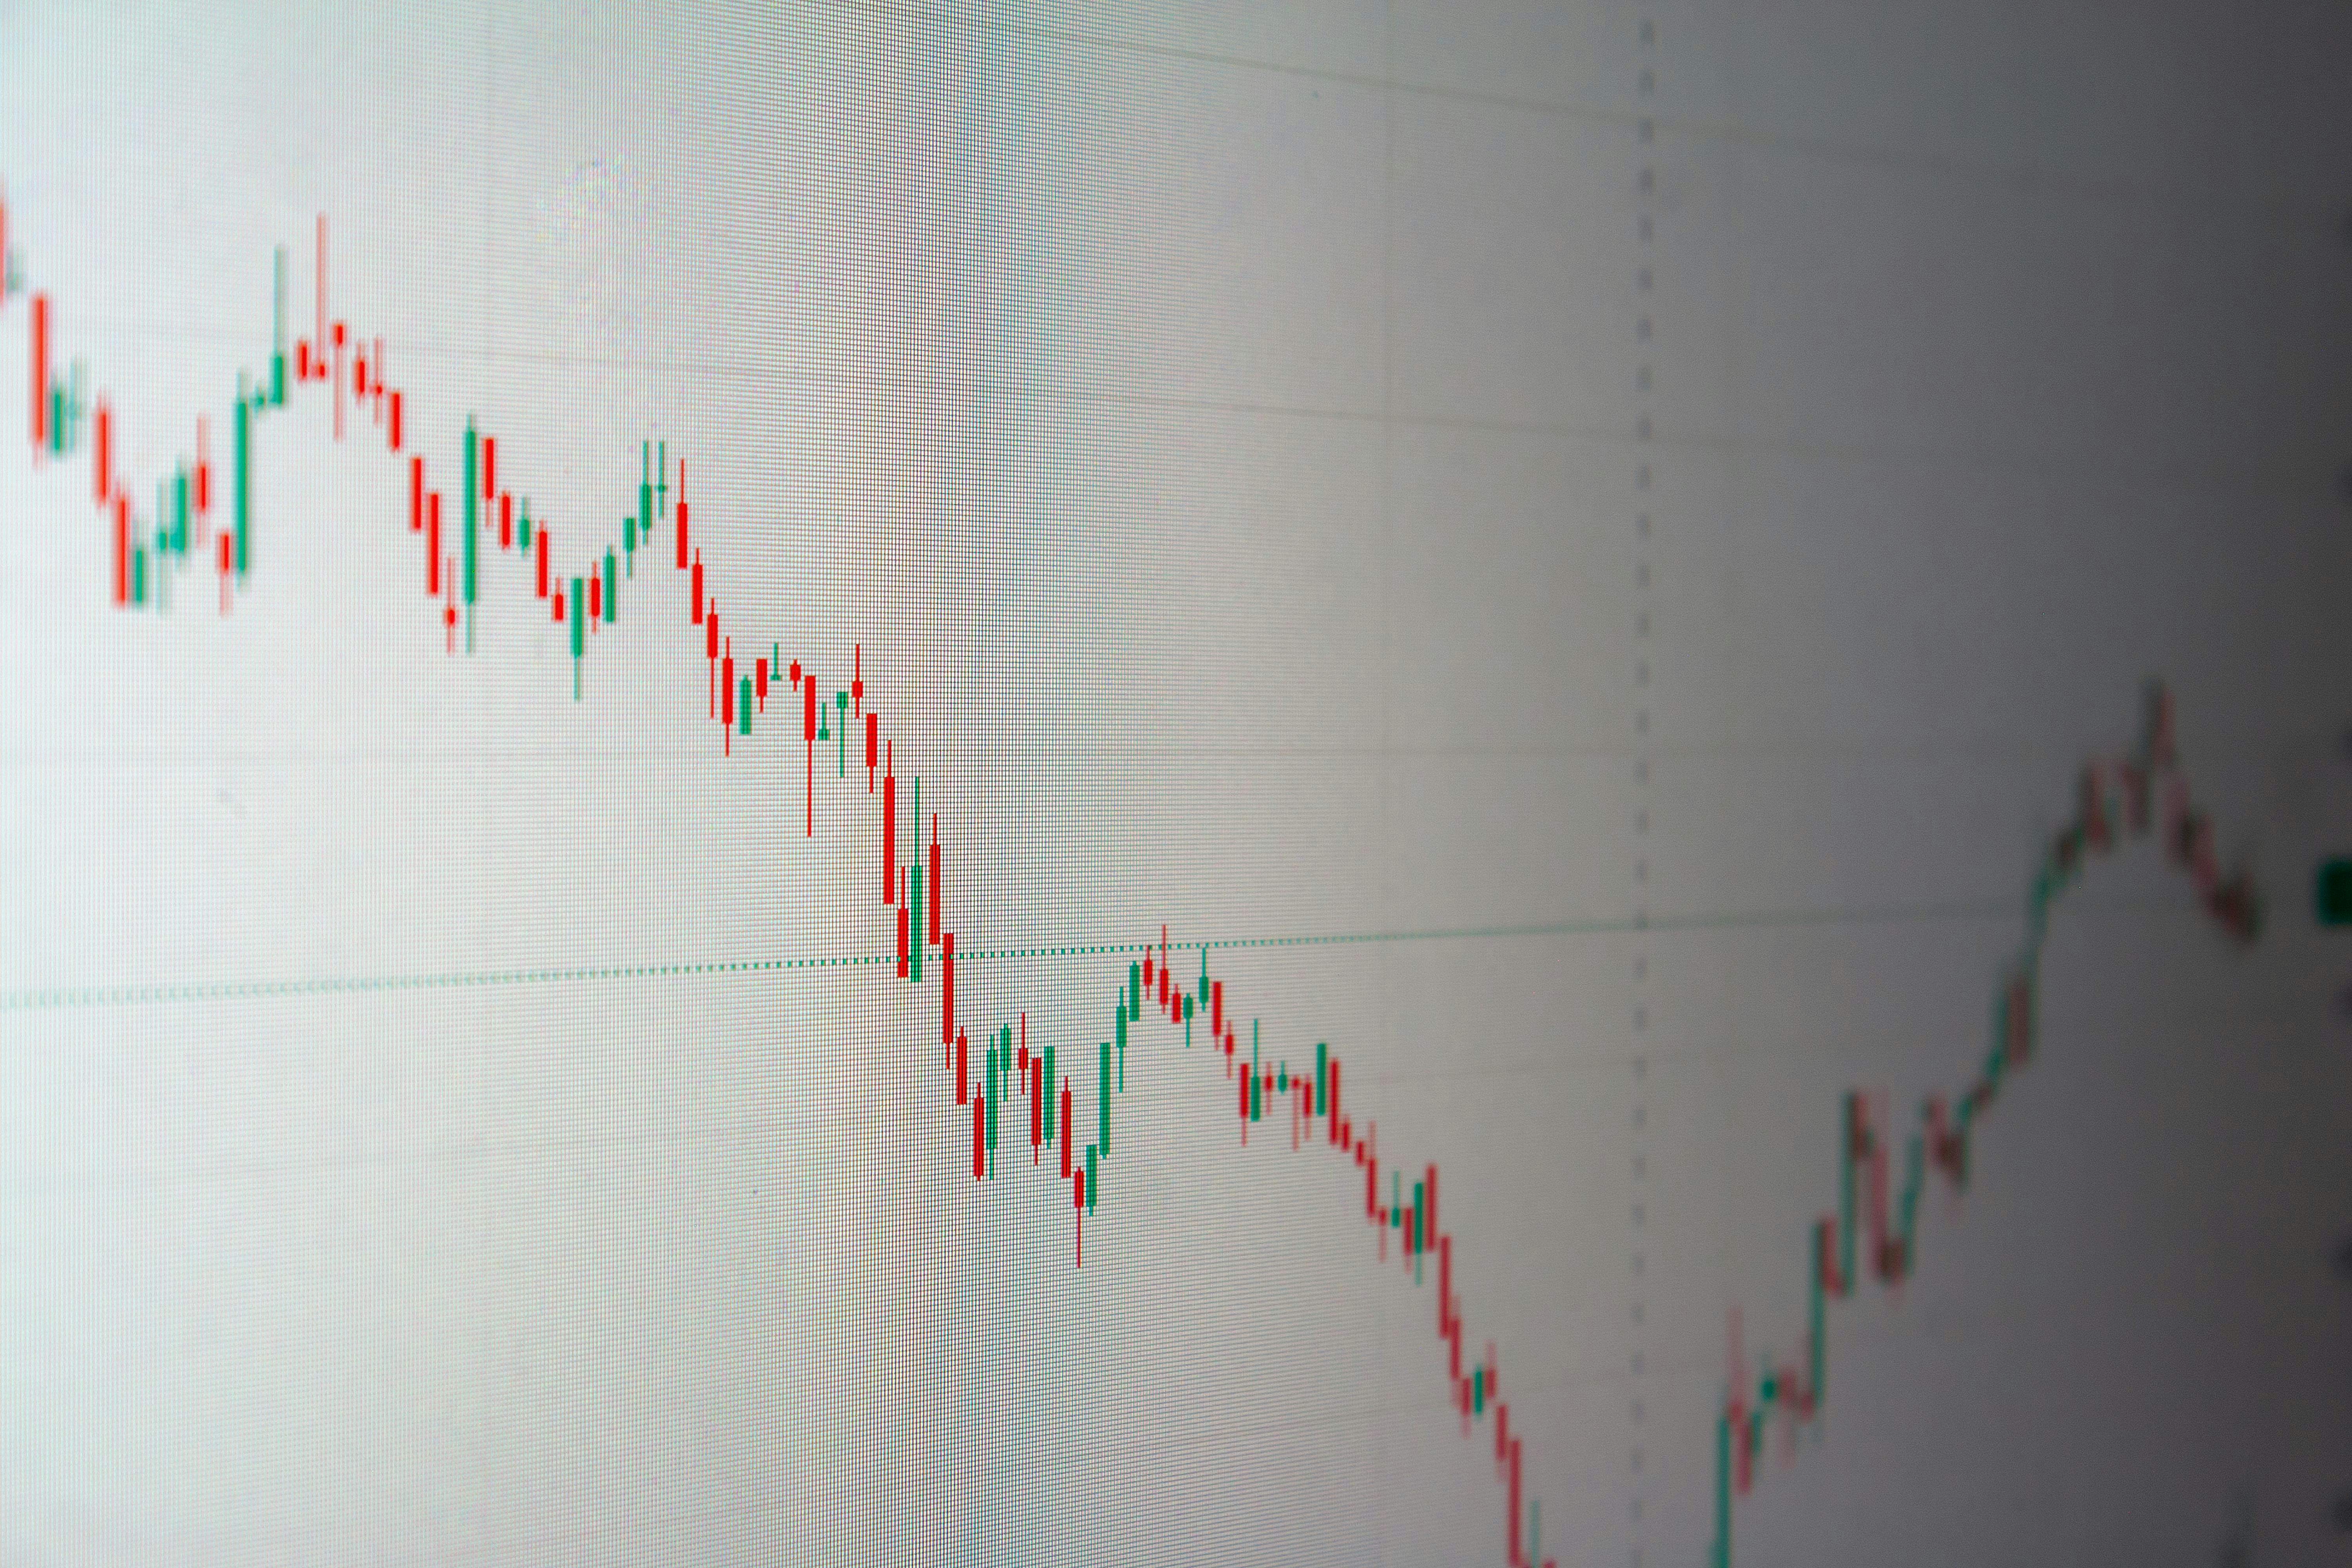
If there’s one habit worth building before any coupon code, it’s this: look at the price history before you hit “Buy.”
A sale tag tells you what a store wants you to think. A price history chart tells you what actually happened. Once you get used to reading one, you’ll never look at a “40% off” banner the same way again.
Here’s how to read them, and what to look for.
Where to find price history
Price history is easier to get than most people think. A few common options:
- Price tracking websites. Paste in a product link and they’ll show you a chart of how the price has moved over time.
- Browser extensions. Many trackers have an extension that shows the price chart right on the product page while you shop.
- Store wish lists and alerts. Some stores will notify you when an item on your list drops in price. It’s not a full history, but it helps.
Most of the popular trackers focus on the biggest retailers, so coverage for smaller stores can be spotty. That’s fine. Even one store’s history gives you a good sense of what “normal” looks like for a product.
The three numbers that matter
When you pull up a chart, look for three things before anything else:
- The typical price. Where does the line sit most of the time? That’s the real everyday price, no matter what the “list price” says.
- The lowest price. How low has it gone, and how recently? A low from a long time ago may not come back, especially if the product is getting older or a newer model replaced it.
- The current price. Where does today’s price sit compared to the other two?
If today’s price is close to the lowest it’s been, that’s a strong deal. If it’s sitting right at the typical price with a “sale” label on it, it’s not really a sale.
Patterns worth recognizing
After looking at a lot of these charts, you start to see the same shapes over and over.
The steady line with dips. The price sits in one spot most of the time and drops during sales events. This is the easiest kind to shop. You know what a good price looks like, and you can wait for the next dip.
The slow slide. The price drifts down over months. This is common with tech as it gets older or as a newer model gets close. If you’re not in a hurry, time is on your side.
The bump before the sale. The price goes up for a little while, then “drops” back to where it was before. That’s a discount on paper only. A chart makes this one easy to spot.
The roller coaster. The price jumps up and down constantly, sometimes several times a week. That usually means the store is adjusting prices automatically. Set an alert and let the low come to you.
The sudden cliff. A big drop that doesn’t bounce back. Often that’s a clearance, a price cut or a sign that a replacement is on the way. It can be a great time to buy, as long as you’re fine with the current version.
Things a chart won’t tell you
Price history is a great tool, but it’s not the whole story.
- Seller and condition. Some trackers mix in third-party sellers or used listings. Make sure you’re comparing the same thing: new versus new, sold by the same store.
- Variants. Different colors, storage sizes or bundles can each have their own price history. Check that you’re looking at the exact version you want.
- Coupons and member pricing. Clip-on coupons, checkout discounts and member-only prices often don’t show up on the chart. The real price may be lower than the line.
- The future. A chart shows you what happened, not what will happen. It’s a guide, not a promise.
How to use it to decide
Here’s a simple routine to follow:
- Pick the exact product and version you want.
- Look at the history and note the typical and lowest prices.
- Set a target price somewhere between the two that you’d be happy paying.
- Set an alert for that target.
- Buy when it hits, and don’t second-guess it.
If you need it right away, it’s still worth checking the chart. It tells you whether today is a reasonable day to buy or whether you’re paying more than usual. Sometimes the answer is “this is fine,” and that’s good to know too.
The bottom line
Price history turns shopping from guessing into knowing. Thirty seconds with a chart can tell you whether a sale is real, whether you should wait, and what a fair price actually looks like.
When you’re ready, browse the latest deals, and if you spot a price that looks too good to pass up, send it my way.